For the last several months I've been building Lumifin, an app that projects your net worth through retirement using your own income and expense plan, real US tax math, and projected healthcare costs, year by year. The hero metric is a number called Confidence Spend™: the most you can safely spend each year and still reach your target ending balance.
It answers the question every retiree asks: "How much can I actually spend without running out of money?"
And yet I realized I wasn't sure I'd be confident enough to actually spend it.
The old Confidence Spend
Confidence Spend was meant to mean exactly what it sounds like: how much you can spend each year and feel confident about it.
The math used your own projection assumptions (say, 0% real on cash and 5% real on stocks), then solved for the largest annual spend that still hit your target ending balance. Honestly, it should have been called "Max Spend." It was based on a projection, not a worst case. And a projection doesn't shield you from the downturn that's eventually coming.
The problem isn't the math, it's the projection
The math was fine. The projection was the problem. It assumed a smooth expected return, a path the market never actually delivers. Even a conservative average rate doesn't fix that. The number didn't feel real because the projection wasn't.
The fix is a bucket strategy with conservative dials on both sides.
If you haven't run into the term, a bucket strategy organizes your retirement money by time horizon. The money you'll need in the next several years sits in cash, CDs, or short-duration bonds, assets that barely move with the market. The rest stays in stocks, where volatility is fine because you have the time to let it grow.
Two knobs decide how conservative the projection is: how many years of withdrawals you keep in the safe bucket, and what real return you assume for the stock bucket. I dialed both conservative.
The safe bucket holds the next 8 years of expected withdrawals and earns 0% above inflation. Everything else stays in stocks, earning 3% real.
Here's the reasoning. Any time you're forced to sell shares into a falling market, you lock in losses the portfolio can't recover. Historically, US stock downturns have recovered within about 8 years. So with 8 years of withdrawals in the safe bucket, you never have to sell stocks at the bottom: you spend the bucket and let stocks recover. Each year the model resizes the safe bucket to cover the next 8 years, and the rest sits in stocks. That buffer stays with you for life, not just the first decade. It's the standard bucket-strategy advice you'll find from Bogleheads, Morningstar, and most retirement researchers.
And 3% real for stocks is deliberately pessimistic. It's the worst 30-year rolling real return for US stocks in recorded history, going back to 1871. The historical median is closer to 6.5%. So the projection answers a hard question: what survives even if stocks deliver the worst 30-year stretch they've ever delivered, and you avoid selling them at the worst possible moment?
Two numbers come out of this
Confidence Spend, in dollars: the most you can spend each year and still cover your full planning horizon. Same name as before, but from an honest projection.
Money Lasts, in years: at your current spending, how long does your portfolio last?
Both are built on the same conservative floor, so you don't have to white-knuckle a market drop in year three. You commit to the number and live your life.
This works whether you're retired or still working. In retirement, the cash bucket is real: you hold 8 years of forward withdrawals in CDs, money market, or short bonds, refilled from stocks each year. While you're still working, your salary covers today's spending, so if retirement is more than 8 years out, the cash bucket is $0 and everything stays in stocks. As retirement approaches, the bucket ramps up. Either way, Money Lasts projects from your actual plan (earning years, retirement date, Social Security, required withdrawals) and tells you how long your portfolio lasts under the conservative floor.
That's why Money Lasts answers two questions at once: "Will I outlive my money?" for retirees, and "How close am I to making work optional?" for everyone still saving.
When I ran the redesign on my own account, my Confidence Spend dropped by about $6K a year. But for the first time I felt I could actually spend up to that number without fear of outliving my money. That was the whole point.
A real case
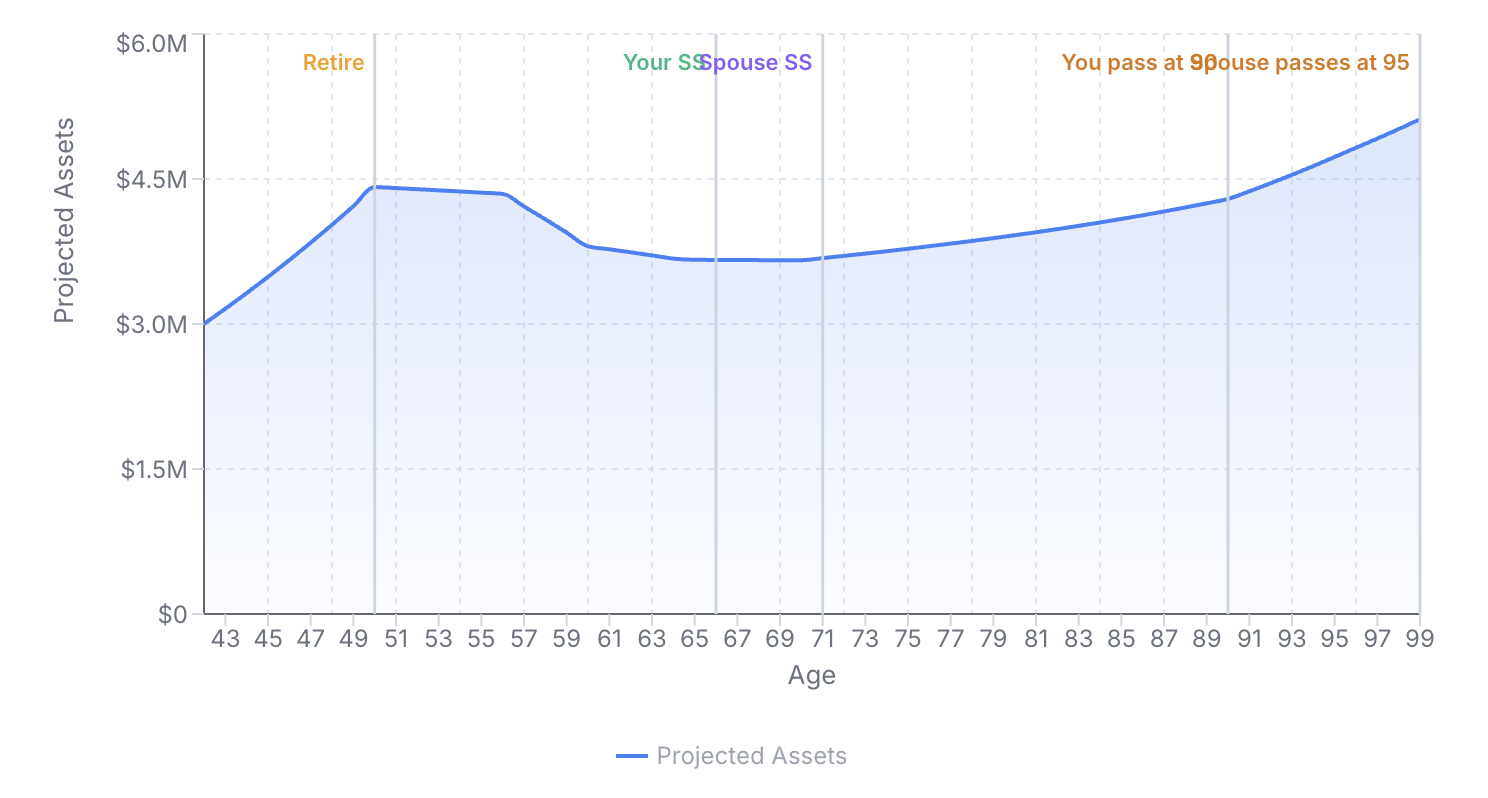
Take a 42-year-old couple, $3M saved, planning to retire at 50, spending $120K a year.
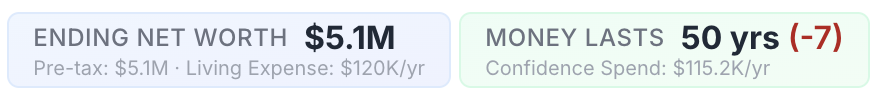
Under expected (smooth) returns, the plan looks great: the portfolio grows through their earning years, dips as they draw down, and recovers to $5.1M by age 99. They never run out.
But "expected returns" is the smooth path markets never actually deliver. Run the same plan through the conservative floor (the safe bucket sized to 8 years, the rest in stocks at 3% real), and it's a different story. The portfolio depletes about 7 years before the end of their plan.
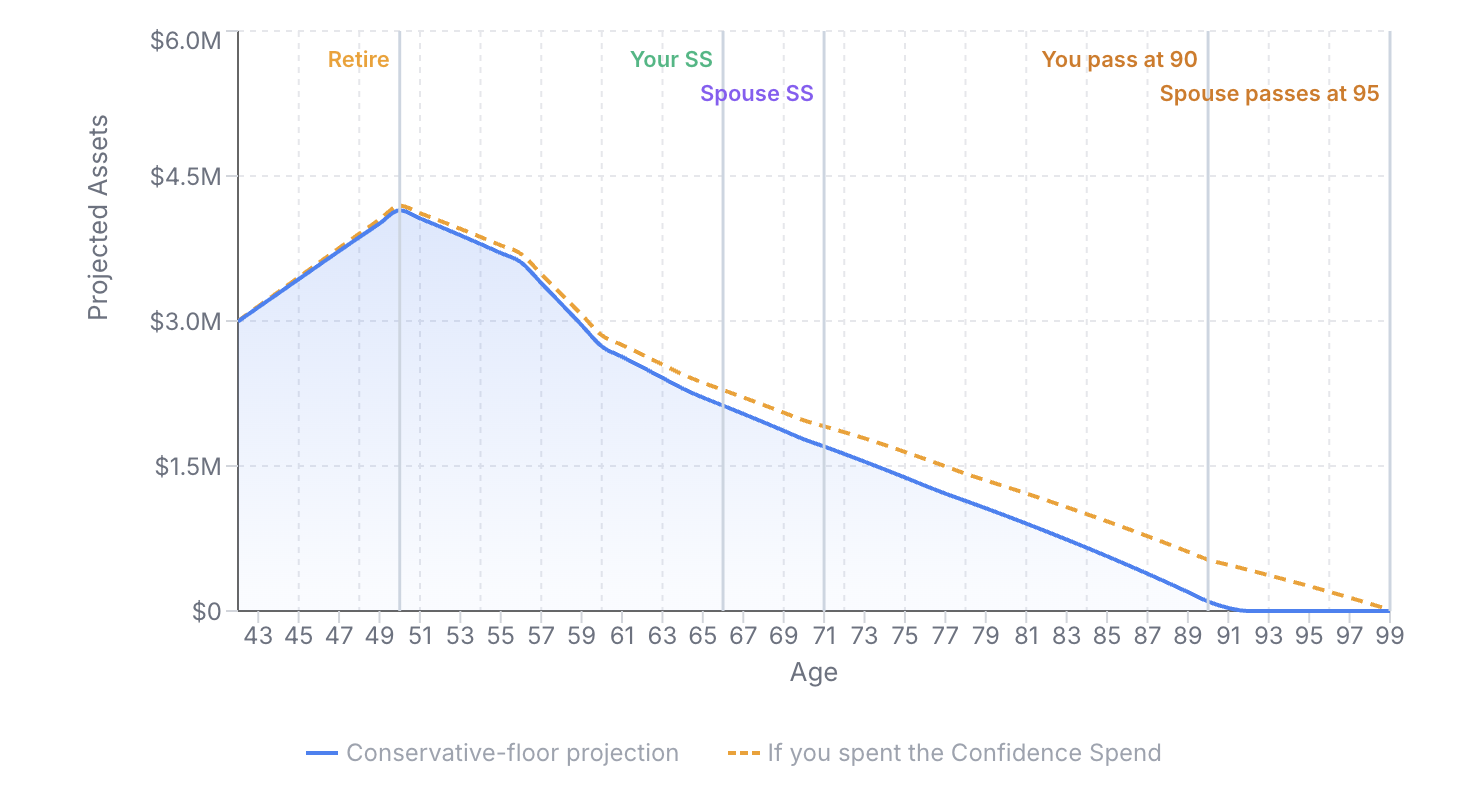
Two numbers fall out:
- Confidence Spend: $115.2K a year. The most they can spend and still cover the full plan under the conservative floor.
- Money Lasts: 50 years. At $120K a year, the portfolio funds 50 of the 57 years they're planning for. A 7-year shortfall.
The gap doesn't necessarily mean they must cut spending by $4.8K a year. Confidence Spend is the number they can spend with confidence, not the maximum they could spend. It's built on a floor designed to survive market volatility, which is exactly what makes it both realistic and conservative.
And one more thing about this couple: they're 42, more than seven years from retirement and decades from the runout point. A lot can shift. Stocks will probably beat the conservative 3% (it's the worst case, after all), their income could grow, their plans could change. The conservative floor is an honest snapshot from today, not a verdict on 2080. The point isn't to act once. It's to know where you stand now, and rerun it every year as life unfolds.
What I hope this changes
For a 65-year-old whose plan shows money lasting past 100 while they live on $80K, I want this to give them permission to take the trip, help the grandkids, and stop living a smaller life than the numbers say they can afford.
For a 45-year-old, I want Money Lasts to give a real answer to "how close am I to making work optional?" Not a forecast. A reference point.
The old number was aspirational. The new one is something you can act on. That's what I'm building toward.
This describes a modeling tool I built and the assumptions behind it. It's educational, not financial advice. The conservative-floor projection is a stress test, not a forecast. Your situation will differ. Talk to a qualified professional before making retirement decisions.